
What Is ROAS? Complete Guide To Return-On-Ad-Spend For PPC
The complete guide to return on ad spend: the ROAS formula, how to track it, what a good ROAS target looks like, and the break-even ROAS your margins actually dictate.

As global digitization accelerates, organizations realize the impending need to invest in digital advertising.
In 2018, the total national ad spend exceeded $125 billion – and it is predicted to continue to rise YOY:
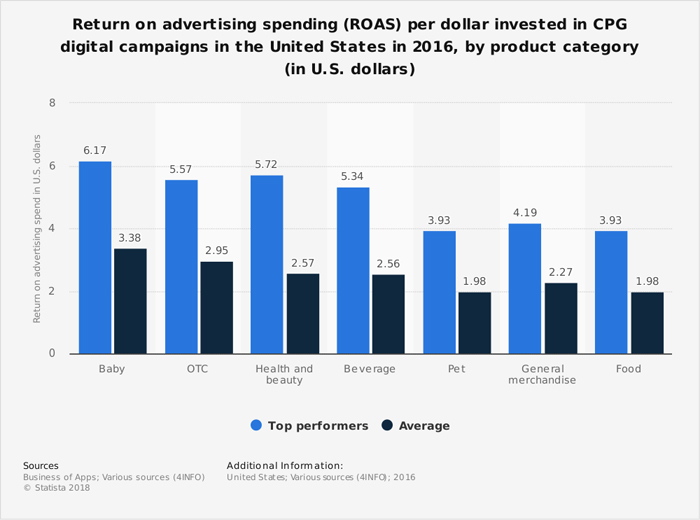
With rising expenditure comes increased scrutiny.
With cutthroat competition, not every ad campaign can drive conversions and offer adequate ROI.
So, how do you know if the money you’re investing is generating revenue or not?
This is where ROAS comes in.
ROAS, or return on ad spend, is a metric for online advertisers, enabling them to track the money they make.
By calculating ROAS, you will know how many dollars you earn for each dollar spent. Additionally, it will determine which ad strategies and techniques work well so that you can apply those to your other ad campaigns.
This guide walks through the ROAS formula and how to calculate return on ad spend, how to track it across Google Ads and Meta, how to derive the break-even ROAS your gross margin actually dictates, how blended ROAS and marketing efficiency ratio (MER) differ from channel-level numbers, and how to set a target ROAS (tROAS) bid strategy that chases profit instead of gross conversion value.
Difference Between ROAS And ROI
ROI, or return on investment, is a business-centric metric used to evaluate the effectiveness of your marketing efforts as a whole.
It helps you understand how ads are contributing to your overall business finances and profit.
On the other hand, ROAS assesses the performance of specific campaigns, ad groups, or keywords.
As it focuses on individual advertising campaigns, ROAS is an ad-centric metric. It measures the gross revenue generated based on each dollar spent on ads. This way, you can learn which of your paid ad campaigns are useful and which ones you need to stop pouring money into.
Figure 3 — ROAS vs. ROI
Where $1,000 of ad-driven revenue actually goes at a 4× ROAS
A worked example: $250 of ad spend returns $1,000 in revenue. ROAS looks excellent — but ROAS only ever sees the first slice.
- Ad spend — $250
- Cost of goods + overhead — $650
- Profit — $100
← Scroll the chart sideways →
Gross ROAS
4.00×
$1,000 revenue ÷ $250 ad spend
Profit on ad spend
0.40×
$100 profit ÷ $250 ad spend
Net margin on revenue
10%
$100 profit ÷ $1,000 revenue
The gap between those two numbers is where most paid search budgets quietly leak. A campaign can post a headline 4.00× return on ad spend and still contribute almost nothing to the bottom line once cost of goods sold, fulfillment, platform fees, and agency management are deducted. That net view has its own name — profit on ad spend (POAS) — and it is the number your CFO cares about.
The same logic applies to acquisition economics. If your customer acquisition cost (CAC) is only justified by repeat purchases, a first-order ROAS understates the channel and your customer lifetime value (LTV) is doing the real work. Read our companion guide on how to calculate the ROI for PPC for the full contribution-margin walkthrough, and optimizing for profit instead of CPA, CPL, or ROI for how to restructure campaigns around it.
How To Calculate Your ROAS?
To calculate ROAS for Pay-Per-Click (PPC) ads, you need to know the total PPC revenue generated by your ad strategy and the total cost of managing your ad strategy.
This includes revenue you earn from all different sources, such as product purchases and lead conversions.
Similarly, your cost includes all the expenses you incur when running your ads, such as Cost-Per-Click (CPC), management fees, software upgrades, and partner/vendor costs. Additionally, if you have purchased clicks and impressions, they will add to your expenses.
Now that you have these two figures, you just have to plug them into the ROAS formula.
There are two formulas you can use:
Formula 1
Divide the revenue you made from your ad campaign with the amount you spent to run your ad.
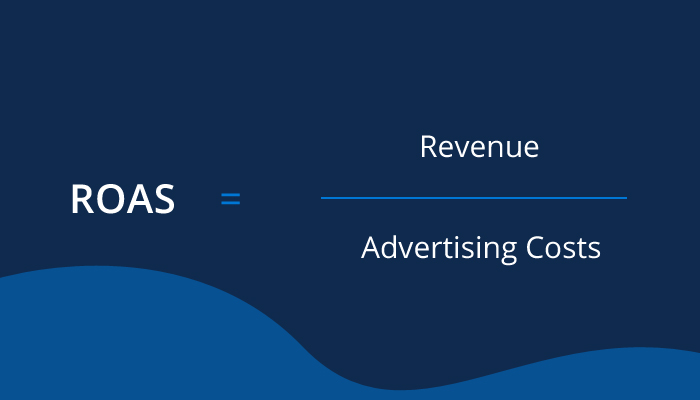
So, for example, you spend $200 on a PPC campaign and make $400 in return. Adding these values to the formula will give you a ROAS of $2. This means you’re making $2 for every $1 you spend.
However, calculating ROAS through this formula only gives you a general overview. It doesn’t tell you the overall profitability of your campaign.
So, for example, you spend $200 and make $400. But your vendor fees also cost $50. Then, the ROAS you calculate will not accurately depict the return you get.
For this reason, it’s better to use the second formula.
Formula 2
If you subtract your cost from the revenue before dividing the result by the cost, it will give you an adequate ROAS.
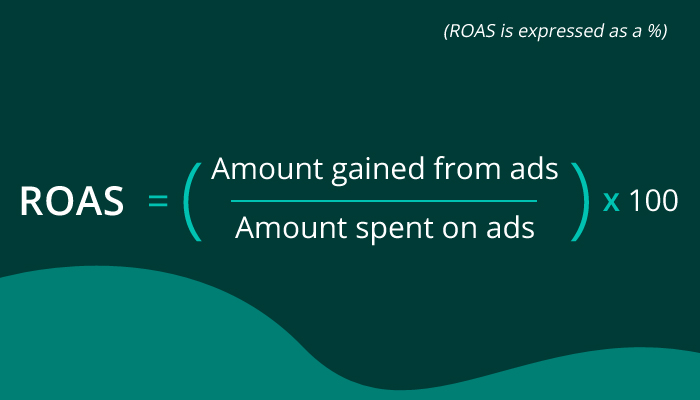
This formula doesn’t require you to evaluate any new values since it only needs the total revenue and cost. And plugging values in this formula will help you determine your marketing budgets effectively.
Break-Even ROAS: The Target Your Margins Actually Dictate
Neither formula answers the question every advertiser really has: what ROAS do I need? That number is not a benchmark you borrow from a blog post. It falls out of your gross margin.
Break-even ROAS = 1 ÷ gross margin. Sell at a 50% gross margin and every $2.00 of revenue leaves $1.00 to cover the ad that produced it — so 2.00× is where you stop losing money. Sell at a 20% margin and you need 5.00× to reach the same standstill.
Figure 2 — Break-even ROAS
Your gross margin sets your break-even ROAS
Break-even ROAS = 1 ÷ gross margin. Thinner margins demand a far higher return before a campaign contributes a single dollar of profit.
← Scroll the chart sideways →
Two practical consequences follow. First, a thin-margin retailer and a high-margin software company can run the identical 3.00× ROAS and land on opposite sides of profitability. Second, the break-even figure above is a floor, not a target — it covers cost of goods only. Layer in fixed overhead, platform fees, and management costs, then add the margin you actually want to earn, and you have a target ROAS worth bidding toward.
Run the calculation per product line rather than per account. Blended margins hide the SKUs that are subsidizing everything else, and they are the first thing to look at when you are trying to bring down cost per click without cutting volume.
How To Track Your ROAS
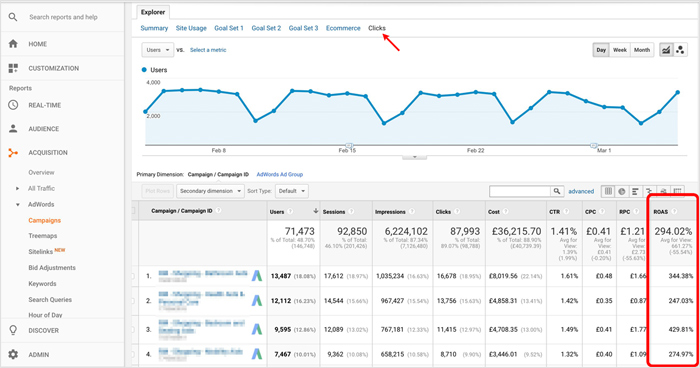
ROAS is a metric that needs to be tracked regularly. Ideally, you should track your ROAS throughout the ad campaign instead of at one particular time.
Although there are many indicators you can utilize to assess the success of your marketing campaigns, the end goal of your business is to earn more money.
This means tracking conversions and sales isn’t enough on its own; you need to fit them within your ROAS tracking mechanism.
But first, you need to calculate your revenue. And you can do it by following the two steps below.
Tracking Conversions
The first step is to track your conversions. And you can easily do that on online advertising platforms like Google Ads, Facebook, Twitter, and Bing Ads.
All you need to do is use these platforms to set up an ad campaign and conversion tracking. If you’re using Google Ads, you can even track phone call conversions.
This way, you will know which clicks on your PPC ads led to which purchases. In addition, you will stay updated on your conversion rates and purchases that result from ad clicks.
Tracking Sales
The next step is to connect your online advertising platform to customer relationship management (CRM) software.
By doing this, you can tie all your marketing data to a new lead. Hence, when a lead converts into a customer, you’ll know exactly which marketing efforts led to the sale.
So, by tracking your conversions and sales, you get access to your revenue data. Simultaneously, the advertising software you use will detail your ad spend.
Now, all you need to do is plug the values in any of the two ROAS formulas, and you’ll know whether your money is being spent right or not.
Why Is Calculating ROAS Important For Businesses?
ROAS enables you to gather valuable insights – based on which you can make informed marketing decisions.
Since the final goal of advertising is to make money, calculating ROAS should be a priority. Even though conversion rate and click-through rates are essential, they don’t guide you regarding changes to your advertising model.
In addition, knowing your ROAS can help you do the following:
- Get accurate data for supporting ad spend increases and budget changes
- Determine high-performing ad groups, PPC campaigns, and keywords
- Procure a benchmark average, which you can measure all your future calculations against
How Does ROAS Data Fill The Gaps In Your Marketing Insights?
Using other metrics alone will not give you complete insights, so you will not make informed marketing decisions.
Think about click data – it tells you the best click-through rate (CTR) and the lowest cost-per-click (CPC). So based on this data, you might think you can evaluate which of your campaigns are successful. But that’s not possible because CTR and CPC don’t tell you the quality of clicks and the traffic you’re getting.
Similarly, conversion data helps you track conversions and point out areas of weakness in your strategy. But it will not determine the quality of traffic and leads you are receiving.
However, ROAS ties all these metrics together by providing you with actual numbers you’re earning and spending on each channel.
Additionally, various factors result in a lower CPC or conversion rate, but that doesn’t mean your campaign is unsuccessful. In fact, such campaigns can still have high profitability. But if you don’t calculate ROAS, you won’t know that.
And then you will make decisions that will cost more than you gain.
What Is A Good ROAS Target
A good ROAS target depends on many factors, including your industry, average CPC, and profit margins. This means a satisfactory ROAS varies from business to business.
In addition, a good ROAS differs from campaign to campaign. For instance, campaigns that aim to raise awareness, grow subscriptions and build a following generally have a low ROAS.
But if you want to drive a greater number of conversions and sales, you should expect a higher ROAS.
Still, no general rule can determine how high your ROAS should be. But, most businesses do aim for an overall 4:1 ratio.
Getting $4 for every $1 spent gives you enough money to keep your business afloat or even make a profit.
Here is a breakdown of different ROAS targets you should be aiming for at different phases of your business:
Figure 1 — ROAS targets
What each ROAS multiple actually returns on $1 of ad spend
Revenue returned per dollar spent, and the profit outcome most advertisers see at that level once fixed and variable costs are counted.
- Losing money
- Roughly break-even
- Profitable
← Scroll the chart sideways →
1x ROAS
Most businesses think if they make a sale that amounts as much as they spent on marketing, they will break even.
But that’s not true because when you factor in all your variable and fixed costs, you are likely making a loss.
So, making $1 for each dollar you spend on your PPC ad campaign is not enough.
2x ROAS
Let’s say you spend $100 on marketing and make a $200 sale. It means you are earning $2 for every dollar you spend.
But, 2x ROAS is still low because fixed costs are generally high, resulting in a deficit.
3x ROAS
As long as you get some consistent sales, you can break even with a 3x ROAS.
For example, you spend $50 on marketing, which results in a $150 sale. So, now, you have an added $100, which you can use to cover additional ad-running costs.
4x ROAS
4:1 ROAS is where you start making a profit, which is why most businesses aim for at least a 4x ROAS.
When each dollar spent gives you $4 in return, you have enough money to make a profit. But ultimately, that depends on your business model and costs.
So, if you have very high variable and fixed costs, it may not result in a profit. But that is often not the case.
5x ROAS
With a 5x ROAS, you can start using your marketing practices to grow your business.
At this stage, you’re making enough profit that you can afford to invest more in your marketing and customize various goal-specific ad campaigns.
In the end, the ideal ROAS for your business depends on your ROAS targets, business expenses, and marketing goals.
Also, if you have different PPC campaigns running simultaneously, set separate ROAS targets for each. Then, calculate their ROAS individually to see if they are bringing in enough cash.
But if your ROAS is still low, look into all other metrics and practices to identify the reasons behind it. Then, when you know which strategies are working, you can implement those across other campaigns.
Blended ROAS, MER, And Why Your Numbers Disagree
Pull ROAS from Google Ads, then from Meta, then from your ecommerce platform, and you will get three different answers for the same week. None of them is lying. They are measuring different things.
Channel ROAS is what an ad platform reports for its own campaigns, using its own attribution window and its own conversion-counting rules. Two platforms running at the same time will both claim credit for the same purchase, so channel ROAS figures routinely sum to more revenue than the business actually booked.
Blended ROAS divides total revenue by total ad spend across every channel. It cannot be double-counted, which makes it the honest top-line number — but it also credits paid media for organic, email, and direct sales, so it flatters you in the other direction.
Marketing efficiency ratio (MER) is blended ROAS applied to all marketing cost, not just media: agency retainers, creative production, and tooling included. It is the closest single ratio to “what did marketing return this month.”
A few habits keep the three reconciled:
- Fix your attribution window before you compare anything. A 7-day click window and a 30-day click window produce very different ROAS for the same campaign.
- Separate view-through conversions from click-through conversions. View-through credit inflates ROAS on upper-funnel and display placements more than anywhere else.
- Feed the platforms first-party data. Enhanced conversions and offline conversion imports recover signal that browser and device privacy restrictions strip out, which makes reported conversion value closer to real revenue.
- Test incrementality on your biggest line items. Geo holdouts and campaign pauses answer the only question attribution can’t: how much of this revenue would have happened anyway.
Track channel ROAS to decide which campaigns to scale and blended ROAS or MER to decide how much the channel is worth in total. Our rundown of the right PPC KPIs to track covers where each of these belongs on a reporting dashboard.
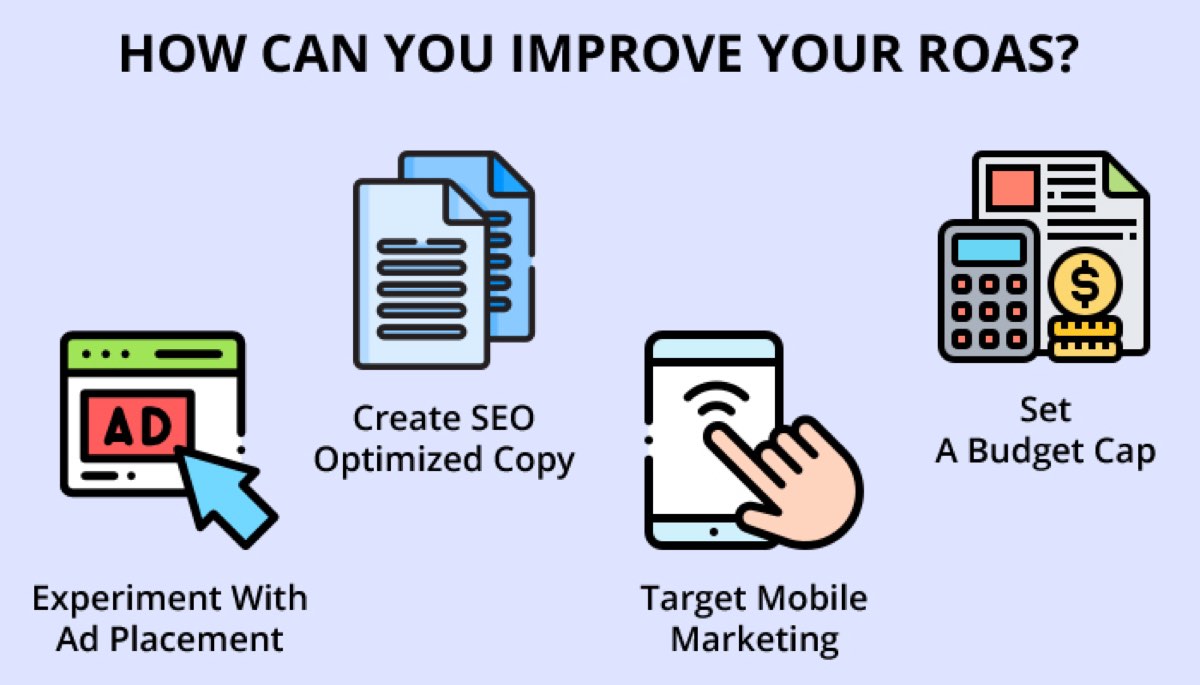
How Can You Improve Your ROAS?
Not being able to meet your ROAS target can be frustrating. But a low ROAS doesn’t always mean that your campaign is a complete failure.
Sometimes, you can make small changes to your current campaign to increase ROAS.
Some tweaks you can make are:
Experiment With Ad Placement
Placing an ad at the right location is key to attracting quality traffic. So if you have a low ROAS, consider changing the location of your ads.
For example, try placing them on e-commerce sites or social networking sites. Additionally, you can change the layout for your ad, such as converting a banner ad with a pop-up.
Create SEO Optimized Copy
Your ad copy should gauge the user’s attention, resulting in the maximum number of ad clicks.
Similarly, your ad copy should be optimized for SEO so that your ad can show up organically in search results.
A helpful tip to follow is to use specific, long-tail keywords that are relevant to your brand.
For more detail, please visit our post outlining and weighing the difference between SEO and PPC.
Target Mobile Marketing
Targeting 56.16% of all web traffic that comes through mobile phones can boost your ROAS.
If your advertising campaign is limited to desktops and isn’t generating high revenue, you should consider running mobile ads.
Set A Budget Cap
Use your ROAS to eliminate campaigns that are performing extremely poorly. Instead, use that money and effort on campaigns that show growth potential.
At the same time, try not to get carried away with spending on ad campaigns. So, place a cap on your budget for PPC campaigns because lots of click-throughs are only beneficial if your budget supports them.
Setting A Target ROAS (tROAS) In Google Ads
Once you know your break-even number, you can hand it to the bidding algorithm. Target ROAS is a Smart Bidding strategy: you set the return you want, and Google adjusts bids in each auction to hit that average across the campaign.
It works well, with conditions:
- Feed it accurate conversion values. A tROAS strategy optimizes toward whatever revenue figure you send it. Send gross order value on a business with wildly different per-product margins and it will happily buy the least profitable mix. Value rules and margin-adjusted conversion values fix this.
- Set the target from history, not from hope. Start at or just above the campaign’s trailing ROAS and move it in increments. Set it far above what the account has ever achieved and bidding turns so selective that impression volume collapses.
- Give it enough conversion data. New campaigns without conversion history are exactly where manual bid increases still beat automation.
- Use seasonality adjustments deliberately. Promotions and holiday peaks change conversion rate faster than Smart Bidding relearns.
The same target-return logic drives Performance Max and Maximize Conversion Value campaigns, which is why a wrong conversion value propagates across the whole account. For a fuller treatment, see implementing flexible bid strategies in PPC and our take on whether to avoid automated bidding with Google Ads.
ROAS Frequently Asked Questions
What is a good ROAS?
A good ROAS is any return comfortably above your break-even ROAS, which is 1 ÷ your gross margin. The widely quoted 4:1 rule is a rough default, not a benchmark: at a 70% gross margin you are already profitable at 1.43×, and at a 20% margin 4:1 barely clears cost of goods.
What is a good ROAS for ecommerce?
The same arithmetic applies. Ecommerce margins vary enormously by category, so calculate break-even from your own product margin rather than borrowing an industry average, then add your fixed costs and required profit on top. Our ecommerce PPC strategy guide covers the campaign structures that support it.
Is a 3x ROAS good?
A 3.00× ROAS is profitable for anyone with a gross margin above roughly 33%, and unprofitable below it. That is the whole answer — the multiple by itself carries no verdict.
What is the difference between ROAS and ACoS?
ACoS (advertising cost of sale), used mainly on Amazon, is ad spend divided by revenue. ROAS is the same relationship inverted: revenue divided by ad spend. A 25% ACoS and a 4.00× ROAS describe the identical campaign.
How do you calculate break-even ROAS?
Divide 1 by your gross margin expressed as a decimal. A 40% gross margin gives 1 ÷ 0.40 = 2.50×. Add fixed costs, platform fees, and management fees to that floor to reach a target ROAS you can actually bid toward.
Should I optimize for ROAS or profit?
Profit. ROAS is the fastest way to compare campaigns against one another, but it is a gross ratio that never sees cost of goods. Use ROAS to rank, and profit on ad spend to decide where the next budget dollar goes.
In Conclusion
Return on ad spend (ROAS) is a valuable metric that businesses of all sizes can use. And it helps you allocate adequate budgets for numerous ad campaigns.
Globally, 31% of all online users click on ads, which means investing in online advertising has a good chance of increasing leads. But to make the most of your marketing efforts, you need to strategize accordingly.
By regularly tracking your ROAS, you will make informed, data-driven decisions that will eventually boost your revenue.
ROAS is one input in a much bigger system. See how it fits alongside platform selection, keyword strategy, and bidding in our ultimate guide to PPC management.
ROAS means something specific in financial services, where a single new client can be worth $50,000 or more over their lifetime. Our PPC guide for financial advisors, RIAs, and CFPs walks through the client-acquisition math — working backwards from lifetime value to a target cost per click — that makes a $25 click easily worth it.